
BUSINESS
Data-Driven Decision Making: Utilising Power BI for Business Insights

In the contemporary business landscape, making decisions backed by data is crucial for success. The ability to analyze and interpret data effectively can distinguish industry leaders from others. One tool that has revolutionized the way businesses approach data analytics is Microsoft 365 Power BI. This comprehensive guide will delve into the facets of data-driven decision making and how Power BI serves as an indispensable tool for extracting actionable business insights.
Introduction to Data-Driven Decision Making
Data-driven decision making (DDDM) involves making decisions based on data analysis rather than intuition or observation alone. It ensures that business strategies and operations are guided by factual, quantifiable information, leading to more reliable outcomes. DDDM encompasses collecting data, analyzing it to extract meaningful patterns, and applying these insights to business processes.
Benefits of Data-Driven Decision Making
- Enhanced Accuracy: By relying on data, businesses can reduce errors and biases in decision-making processes.
- Informed Strategies: Data provides a solid foundation for developing strategic initiatives.
- Performance Monitoring: Continuous data analysis helps in tracking performance metrics and making necessary adjustments.
- Competitive Advantage: Companies that leverage data effectively can anticipate market trends and stay ahead of competitors.
Understanding Power BI
Microsoft Power BI is a powerful business analytics tool that enables users to visualize data and share insights across their organization. It provides tools for aggregating, analyzing, visualizing, and sharing data.
Key Features of Power BI
- Data Integration: Power BI can connect to a wide range of data sources, including databases, spreadsheets, and cloud services.
- Interactive Dashboards: Users can create interactive reports and dashboards that provide real-time insights.
- Custom Visuals: Power BI offers a variety of built-in visuals and the ability to create custom visuals.
- Collaboration Tools: It allows teams to collaborate on data analysis and share reports seamlessly.
- Mobile Accessibility: Power BI’s mobile app ensures that insights are available on-the-go.
Setting Up Power BI for Your Business
Initial Steps
- Define Objectives: Clearly outline what you aim to achieve with Power BI. Identify key metrics and data sources.
- Data Preparation: Ensure your data is clean, well-structured, and ready for analysis. This might involve data cleansing and transformation.
- User Training: Provide adequate training to users to ensure they can effectively use Power BI.
Connecting Data Sources
Power BI supports a vast array of data sources, from Excel spreadsheets to cloud-based databases like Azure SQL Database. The first step in utilizing Power BI is to connect your data sources.
- Get Data: Use the ‘Get Data’ feature to connect to your data sources.
- Data Transformation: Use Power Query to clean and transform your data as needed.
- Data Modelling: Create relationships between different data tables to form a cohesive dataset.
Creating Powerful Visualizations
Choosing the Right Visuals
Selecting the appropriate visualization is crucial for effectively conveying your data insights. Here are some common visualizations and their uses:
- Bar and Column Charts: Ideal for comparing categories or tracking changes over time.
- Line Charts: Best for showing trends over periods.
- Pie and Donut Charts: Useful for illustrating parts of a whole.
- Scatter Plots: Great for identifying relationships between variables.
- Maps: Perfect for geographical data visualization.
Customizing Visuals
Power BI allows extensive customization of visuals to enhance clarity and impact. Users can adjust colors, labels, and layouts to fit their needs.
- Formatting: Customize the appearance of your visuals to make them more readable and visually appealing.
- Tooltips: Add tooltips to provide additional information when users hover over data points.
- Drill-Through: Enable drill-through functionality to allow users to navigate to detailed data views.
Creating Interactive Dashboards
Interactive dashboards are a key feature of Power BI, enabling users to explore data dynamically.
- Dashboard Layout: Arrange visuals logically to tell a cohesive story.
- Slicers: Use slicers to allow users to filter data based on specific criteria.
- Bookmarks: Create bookmarks to capture different states of your report and make navigation easier.
Analyzing Data with Power BI
Using DAX for Advanced Calculations
Data Analysis Expressions (DAX) is a formula language in Power BI used for creating custom calculations.
- Measures and Columns: Understand the difference between calculated measures and columns.
- Common DAX Functions: Familiarize yourself with commonly used DAX functions such as SUM, AVERAGE, and CALCULATE.
- Advanced DAX: Explore more advanced DAX functions for complex calculations and data manipulation.
Leveraging AI and Machine Learning
Power BI integrates with Azure Machine Learning to provide advanced analytics capabilities.
- Built-in AI Visuals: Use AI-powered visuals like Key Influencers to identify patterns and trends.
- Integration with Azure: Connect to Azure Machine Learning to build and deploy machine learning models within Power BI.
- Automated Insights: Utilize Power BI’s automated insights to uncover hidden trends and anomalies.
Sharing and Collaborating with Power BI
Publishing Reports
Power BI allows users to publish their reports to the Power BI Service, making them accessible to others within the organization.
- Workspaces: Organize your reports and dashboards within workspaces for better management.
- Sharing: Share reports with specific users or groups and manage access permissions.
- Embedding Reports: Embed Power BI reports in other applications or websites for broader distribution.
Collaboration Features
Collaboration is made easy with Power BI’s built-in tools.
- Comments: Users can add comments to reports and dashboards, facilitating discussion.
- Subscriptions: Set up report subscriptions to ensure users receive updates automatically.
- Version Control: Track changes and manage different versions of your reports.
Best Practices for Power BI Implementation
- Start Small: Begin with a pilot project to demonstrate value before scaling up.
- Focus on User Adoption: Ensure that users are comfortable with the tool through adequate training and support.
- Maintain Data Quality: Regularly check and update your data sources to ensure data quality.
- Stay Updated: Keep up with the latest Power BI updates and features to maximize its potential.
KeaPoint Power BI Consultancy
If you’re looking to enhance your Power BI capabilities further, consider professional consultancy services like KeaPoint. Specialising in Power Platform services, KeaPoint offers expert guidance and solutions tailored to your business needs. Their consultancy can help streamline your data processes, integrate Power BI with other tools, and optimise your overall data strategy.
Explore KeaPoint’s Power Platform Services.
Conclusion
Data-driven decision making is not just a trend but a necessity in today’s data-rich business environment. Power BI stands out as a robust tool that empowers businesses to transform raw data into meaningful insights. By leveraging its powerful features, organisations can make informed decisions, optimise operations, and gain a competitive edge. Whether you are just starting with Power BI or looking to enhance your current setup, embracing data-driven decision making can significantly impact your business’s success.

Introduction
Warehouses operate as integral centers in supply chain management, with heavy loads, brisk movements, and rigorous operational demands. The foundation of any efficient warehouse lies not only in its structure or machinery but in the integrity of its flooring. Selecting superior flooring is essential to ensure the safety and efficiency of day-to-day operations. The right Warehouse Flooring supports productivity and protects a facility from costly repairs or hazards in the future.
As warehouse activities intensify, the risk of accidents or breakdowns due to inadequate flooring increases. Investments in robust flooring protect both logistics and people, addressing common challenges such as impact stress, chemical spills, and abrasion from machinery. Durable flooring solutions are specifically designed to withstand these factors and prevent downtime, providing facilities with a reliable backbone for seamless operations.
Proper installation and material selection scale maintenance routines down, keeping facilities running with minimal interruption. This level of resilience helps warehouses remain competitive and compliant with evolving safety standards. With many tailored options available, warehouse managers can find durable solutions for nearly any operational challenge or environment.
Why Warehouse Flooring Requires a Specialized Approach
The unique conditions of warehouse environments mandate flooring that far exceeds what is typically used in commercial offices or retail spaces. The floors must resist persistent pressure from forklifts, pallet jacks, static racks, and automated equipment. Heavy weights, dropped items, and repetitive traffic put traditional surfaces at risk for early deterioration, potentially causing hazards and unplanned expenses.
Specialized flooring products are developed with enhanced compressive strength and abrasion resistance. They are crafted to withstand chemical spills and solvents while also facilitating easy cleaning and traction. Optimal performance is best achieved when commercial flooring partners assess load demands, environmental exposure, and operational routines. They can then recommend either epoxy, polyurethane, or other durable flooring products as warranted by these factors.

Key Performance Requirements for Warehouse Flooring
- Load-bearing capacity: A floor’s ability to support static and dynamic stresses prevents premature damage from heavy racking systems or constant vehicle movement. Impact resistance helps the floor remain smooth and intact, even with frequent collisions or dropped goods.
- Slip resistance: Accidental slips become more common where liquids, oils, or weather-related moisture accumulate. Preventing falls while avoiding overly rough surfaces that can trap dirt is key to both safety and cleanliness.
- Ease of maintenance: Industrial schedules depend on predictable workflows. Durable flooring often allows spot repairs and avoids large-scale replacement, saving time and reducing overall costs.
Understanding these essential requirements before installation will help guide the best long-term investment and avoid operational interruptions from failed or underperforming flooring systems. According to Buildings.com, proper material and design choices can significantly improve facility safety and ongoing performance.
Epoxy Flooring Systems for Warehouses
Epoxy flooring remains a staple in industrial and warehouse applications thanks to its exceptional strength and resilience. It bonds tightly to concrete, producing a seamless finish that strengthens surface durability while reducing dust accumulation. Many manufacturers also customize epoxy finishes for improved slip resistance or visibility, supporting warehouse safety goals and reducing energy expenses through enhanced reflectivity.
For successful epoxy installation, surface preparation is critical. Moisture testing, proper grinding, and substrate repairs form the foundation for a floor that will withstand rigorous daily use. Professionals are required to ensure longevity, as improper preparation greatly increases the risk of coating failure or bubbling beneath the surface.
Polyurethane and Resin Flooring Solutions
Polyurethane floors offer greater flexibility and can absorb minimal substrate movement caused by temperature swings or structural shifts. This flexibility makes polyurethane an apt choice for warehouses with temperature control zones or those exposed to changing seasons. Resin-based floors, often used in tandem with urethane systems, offer resistance to impact, chemicals, and thermal shock, making them ideal for distribution centers or food facilities with aggressive cleaning routines.
Selecting between epoxy, polyurethane, or hybrid resin floors depends on a warehouse’s exposure to temperature, moisture, and mechanical demands. Experienced flooring professionals evaluate traffic patterns, operational hazards, and the nature of goods handled to ensure optimal system selection and maximum return on investment.
Polished Concrete for High-Traffic Warehouses
Polished concrete flooring is gaining traction for high-density warehouses seeking exceptional longevity and minimal upkeep. Mechanical grinding densifies and strengthens the slab, making it more resistant to scratches, impacts, and stains. Light reflectivity is a bonus that promotes safety and reduces energy use with the same lighting system.
Premium polished concrete starts with a sound slab; substrate flatness and joint integrity are crucial. Professional contractors test and rectify slabs before polishing, ensuring high-quality outcomes that meet the demands of busy warehouse environments.
Vinyl and Composite Flooring in Specialized Warehouse Areas
Certain areas within warehouses, especially those with extended standing or where comfort is desired, may benefit from commercial vinyl or composite flooring. These resilient materials are popular in packaging rooms, offices within the warehouse, or employee rest areas. SPC (Stone Plastic Composite) and WPC (Wood Plastic Composite) floors add comfort and dimensional stability but are not intended for heavy equipment zones.
Integration between hard-surface and resilient flooring requires precision to avoid tripping hazards and ensure seamless operational flow. Skilled commercial flooring installers create custom transitions and plan layouts to maintain safety and support workflow efficiency.
Moisture Considerations in Warehouse Flooring
Moisture is a leading factor in warehouse flooring failures. Floor coverings installed over ground-level slabs or in basements are at risk of vapor transmission that can lead to blistering, delamination, and structural compromise. Modern epoxy and resin systems, when properly specified, frequently include vapor mitigation layers that extend lifespan and maintain appearance.
Pre-installation moisture testing and vapor barrier installation are industry standards for high-performing warehouse floors. Long-term protection against moisture is essential for durability and reduces costly repairs or premature failures. According to Architectural Digest, understanding regional conditions and potential water intrusion is fundamental when evaluating flooring options.
Safety and Compliance in Industrial Flooring
Ensuring compliance with industrial safety codes is non-negotiable for warehouse operations. Slip ratings, joint alignment, and consistent surface finishes help reduce accidents and injuries. Floor markings and high-visibility coatings can also be embedded to direct traffic flow and designate hazard zones, improving safety culture.
Knowledgeable flooring contractors coordinate with warehouse management to guarantee materials and finishes align with all health, safety, and operational regulations. This diligence not only protects workers but also supports a facility’s reputation and reliability.
Long-Term Value of Durable Flooring Systems
The most effective investment in warehouse flooring considers anticipated lifecycle costs rather than just initial pricing. Durable systems typically command a slightly higher upfront expense but offer substantial cost savings over time with reduced maintenance intervals, quicker repairs, and fewer operational interruptions. Facilities that adopt premium materials often experience measurable productivity improvements and fewer workplace incidents.
Laying the proper foundation, both literally and strategically, gives warehouses a competitive edge and assures long-term value for the entire facility.
Final Thoughts
Investing in durable warehouse flooring is more than a cosmetic choice, it is a strategic decision that directly impacts safety, efficiency, and long-term operational costs. By selecting materials suited to traffic patterns, load requirements, and environmental conditions, facilities can minimize downtime, prevent accidents, and reduce maintenance expenses. Professional installation, moisture mitigation, and compliance with safety standards further ensure lasting performance. Ultimately, high-quality flooring serves as the backbone of a well-functioning warehouse, supporting both productivity and workplace safety while providing a strong return on investment.
BUSINESS
Financial Expert Witnesses in Litigation: Roles, Responsibilities, and Real-World Challenges

Introduction
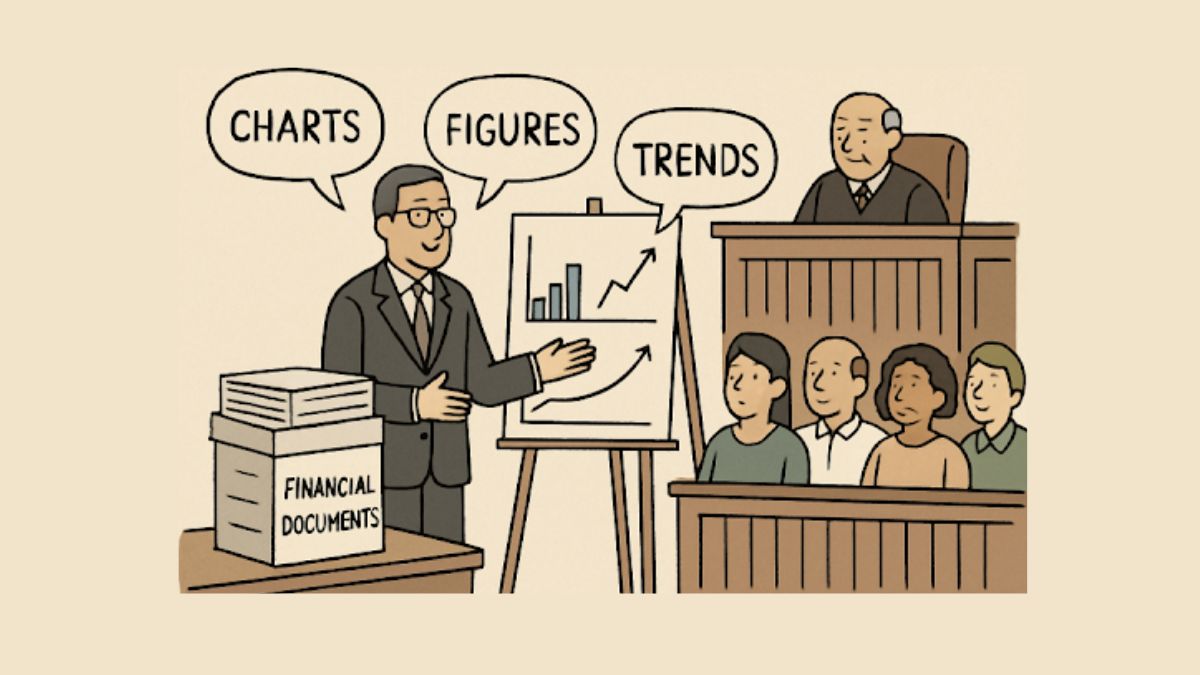
In the complex landscape of litigation, financial expert witnesses are vital for bridging the gap between dense financial data and the legal system’s needs. Their ability to translate technical jargon and intricate calculations into clear, credible testimony allows judges and juries to make informed decisions. In cases involving complex corporate finance, valuation disputes, or alleged financial wrongdoing, a qualified banking expert provides essential clarity.
Financial expert witnesses can be involved in a wide range of cases, including those involving securities law, bankruptcy, contract disputes, marital dissolution, and corporate fraud. Their work ensures that relevant financial matters are explained and understood within the legal context, often making the difference between winning and losing a case. As litigation grows in complexity and stakes, the demand for qualified financial experts continues to increase.
Whether presenting reports, analyzing evidence, or delivering testimony in court, these professionals are uniquely positioned to offer insight into matters ranging from damage calculations to complicated accounting practices. Their opinions often help shape settlement negotiations, mediation outcomes, and trial outcomes.
Importantly, financial expert witnesses are entrusted with upholding the highest standards of accuracy and ethical conduct. They are expected to interpret a wide range of financial documents, regulations, and standards, bringing impartiality and depth of knowledge to every proceeding. Their roles extend far beyond simple number-crunching to include explanation, guidance, and educational components for non-expert participants in the legal process.
Roles and Responsibilities of Financial Expert Witnesses
At the center of a financial expert witness’s work is the ability to analyze, interpret, and present financial information that is often highly technical or disputed between parties. Their primary duties include:
- Analyzing Financial Documents: Expert witnesses scrutinize a range of records, including bank statements, ledgers, tax returns, and audit trails. Their investigation can reveal discrepancies, patterns of behavior, or evidence of misconduct, which may be pivotal in litigation.
- Interpreting Regulations: Laws and regulations governing financial practices can be challenging. Financial experts explain how these laws apply to the case at hand, helping clarify issues for both legal teams and judicial decision-makers.
- Providing Objective Testimony: A critical responsibility is maintaining objectivity, acting as a neutral interpreter of the facts rather than an advocate for either party. Their testimony must withstand scrutiny from opposing lawyers and remain rooted in generally accepted financial standards.
- Authoring Reports: Detailed expert reports are generated to summarize findings, methodologies, and opinions. These documents are critical for pre-trial disclosure and often form the basis of direct and cross-examination at trial.
- Explaining Valuation and Damages: In disputes over business value or financial damages, experts use established models to assess losses or valuations, providing crucial context for monetary awards or settlement calculations.
In each of these areas, the expert’s role is to clarify the facts for a non-technical audience and to support their opinions with recognized standards and methodologies. The U.S. Courts’ guide on expert witness testimony underscores the importance of these responsibilities for ensuring fair proceedings.
Challenges Faced by Financial Expert Witnesses
Despite their expertise, financial expert witnesses navigate significant professional and ethical challenges. The adversarial nature of litigation places enormous pressure on experts to remain neutral, and the effectiveness of their testimony often hinges on communication and credibility.
- Maintaining Objectivity: A cornerstone of credibility is the ability to provide impartial, independently formed opinions, regardless of the party that hired them. This can be particularly difficult in high-profile or high-value cases, where the financial stakes are enormous, and attorneys may aggressively challenge expert findings.
- Communicating Complex Information: Experts must distill highly complex financial concepts into language accessible to juries and judges with no financial background. This requires a blend of teaching ability, patience, and adaptability, ensuring that no key details are lost in translation.
- Cross-Examination and Scrutiny: Financial experts often face intense cross-examination designed to test the limits of their expertise, expose any inconsistencies, or undermine their conclusions. Preparing for this level of scrutiny is a key part of their role.
- Changing Regulatory Standards: Financial regulations evolve, and staying current with new standards is essential for credible testimony. Continuous education and adaptation are required to maintain relevance and authority.
In this environment, even highly experienced experts must constantly update their skills, methodologies, and knowledge base to continue providing reliable analysis.
Real-World Examples of Financial Expert Witness Impact
The influence of a financial expert witness is often most visible through case studies. In one landmark case, a financial expert played a central role in uncovering a complex fraud scheme involving manipulated ledgers and hidden assets. Their painstaking forensic analysis brought to light systematic efforts to mislead shareholders, ultimately leading to a favorable outcome for the plaintiffs and to the holding of corporate wrongdoers accountable.
In another example involving a partnership dispute, a financial expert’s valuation report resolved ambiguities about the business’s true value, preventing a lengthy and costly trial. With their unbiased opinion and transparent methodology, the parties reached a settlement that reflected the firm’s true financial position.
These real-world examples underscore the pivotal role that financial experts play not just in the courtroom but in shaping litigation strategies and promoting settlements. Their input can make the difference between clarity and confusion when large sums and reputational concerns are at stake.
Conclusion
Financial expert witnesses are indispensable to the modern legal process. By delivering clear, objective, and credible financial analysis, they help ensure that justice is based on facts rather than speculation. While the challenges they face are significant, their ability to distill complicated information and remain neutral in the face of adversity makes them indispensable in countless cases. As the demands of financial litigation continue to evolve, so too does the role of the expert witness, who remains a guarantor of fairness, accuracy, and clarity in the courtroom.

Modern workspaces are changing rapidly, fundamentally transforming how teams function and interact in professional settings. The traditional boundaries that once defined an office are blurring as companies recognize the impact of work environments on creativity, productivity, and job satisfaction. Advancements in technology, combined with innovative interior design and organizational shifts, are revolutionizing the work experience. Organizations across every industry are continually seeking ways to foster adaptability, nurture creativity, and create a culture of engagement for their employees. For businesses or entrepreneurs eager to rent office space, understanding these emerging workspace trends is more important than ever for maintaining a strategic edge in today’s competitive landscape.
This evolution isn’t just about updating office aesthetics or fleeting trends. It’s a holistic response to the diverse needs of modern professionals. In today’s workspace, layout and amenities are thoughtfully designed to facilitate intuitive collaboration and seamless communication. Flexible layouts, multi-purpose spaces, and smart integrations empower teams and drive innovation. As priorities shift, there’s renewed focus on employee well-being and work-life balance, which positively affects company culture, performance, and staff retention. Leaders recognize that investing in people and spaces is key to long-term success, fostering a culture of creativity and productivity.
Workplace transformation transcends corporate offices or trendy startup hubs; it affects government agencies, nonprofits, and small local businesses as well. The widespread demand for adaptable workspaces is reshaping cities and business districts, as flexible office solutions become more desirable and accessible. Alongside these changes, there is a growing trend toward meeting space rentals that offer a professional, fully equipped setting for both short-term and recurring needs. These purpose-built collaboration zones offer flexibility, advanced connectivity, and a cost-effective alternative to maintaining large, permanent office footprints, making them especially attractive to organizations seeking to scale dynamically or accommodate fluctuating team sizes.
The Shift Towards Flexible Work Environments
The traditional corner office and cubicles are being replaced by modular, multi-use layouts designed for dynamic work styles. These flexible environments allow for quick reconfiguration to support various work activities, catering to employees’ desires for autonomy in their workspaces. A Harvard Business Review report indicates that companies investing in adaptable office designs see increased morale, engagement, and job satisfaction, essential for attracting top talent, especially younger generations seeking both independence and community.
Integrating Technology for Seamless Collaboration
The digital revolution in office design extends beyond fast internet and powerful computers. Cloud platforms now offer secure, 24/7 access to files and teamwork tools, allowing contributions from anywhere. Real-time editing, management dashboards, and instant messaging erase distance and time barriers. As remote work grows, demand for virtual collaboration tools has surged. Innovations like virtual and augmented reality are changing how teams brainstorm and solve problems—enabling immersive, interactive sessions regardless of location. These advances foster more agile organizations, with decision-making and problem-solving flowing across departments and borders. Consequently, businesses become more productive and better prepared for modern market challenges.

Designing for Spontaneous Interactions
Physical design choices in the workplace profoundly impact the frequency and quality of human interactions. Modern office layouts favor open spaces, informal gathering zones, and communal amenities—such as cafés, lounges, or game rooms—over private, closed-door offices. These intentional designs create natural opportunities for coworkers to exchange ideas and connect outside of formal meetings. Unscripted moments and incidental conversations, often sparked while passing through common areas, have been shown to drive greater knowledge sharing and creativity within teams. In fact, a study published in the Harvard Business Review notes that proximity and spontaneous encounters are critical for fostering an innovative work culture. Strategic use of glass walls, writable surfaces, and dynamic seating arrangements further encourages interaction while still offering zones for privacy when needed.
Prioritizing Employee Well-Being
In today’s workforce, businesses are increasingly aware that prioritizing employee well-being is not just a perk but a necessity for sustainable growth. Natural elements such as daylight, potted plants, and living walls—tenets of biophilic design—are now mainstream and have been shown to reduce stress and increase cognitive performance. Ergonomic furniture, height-adjustable desks, and active workstations support physical health, decreasing the likelihood of work-related injuries and promoting daily movement. Many forward-thinking companies have also integrated relaxation zones and meditation rooms to offer employees mental respite during busy workdays. These thoughtful investments in health and wellness lead to higher worker satisfaction, less absenteeism, and ultimately, better organizational outcomes. Health-conscious design can even influence recruitment and retention, as professionals increasingly seek organizations that demonstrate care for their staff’s physical and mental well-being.
Supporting Hybrid Work Models
With the rise of hybrid and remote work, physical offices are shifting from daily workspaces to collaboration hubs for teamwork, creativity, and culture-building. Essential features now include high-quality video conferencing, projectors, reliable Wi-Fi, and meeting rooms. Digital infrastructure that supports both in-person and remote workers enables effective collaboration regardless of location. As organizations adopt flexible work to expand talent access and improve work-life balance, investment in hybrid-ready infrastructure will grow, keeping companies competitive and resilient amid change.
Embracing Co-Working Spaces
Co-working spaces represent a major shift in office real estate, offering flexible solutions from shared desks to private offices. They foster community and networking, benefiting freelancers with amenities and support, and helping startups and companies collaborate and share resources. These spaces appeal to various work styles, emphasizing adaptability and collaboration. As remote work rises, co-working spaces will likely remain vital and evolve to meet future needs.
Conclusion
The definition of a successful workspace is constantly evolving as organizations learn to prioritize flexibility, smart technology integration, and employee well-being. By investing in thoughtful office design, nurturing serendipitous interactions, and building frameworks to support hybrid and collaborative work models, today’s companies can pave the way for greater productivity and ongoing innovation. As expectations about the workplace continue to shift, the organizations that adapt decisively and embrace these new norms are likely to thrive—remaining resilient, engaged, and competitive in a continuously changing world.
-

 HEALTH2 years ago
Integrating Semaglutide into Your Weight Loss Plan: A Practical Guide
-

 HOME IMPROVEMENT2 years ago
How to Choose the Perfect Neutral Area Rug for Every Room
-

 FASHION2 years ago
7 Celebrity-Inspired Elegant Summer Dresses For 2024
-

 LAW2 years ago
Teenage Drivers and Car Accidents in California: Risks and Parental Liability
-

 CONSTRUCTION2 years ago
Construction Site Safety Regulations in New York and Your Rights as a Worker
-

 HOME2 years ago
Sandra Orlow: The Teen Model Who Captivated the Internet
-

 LAW2 years ago
Post-Divorce Considerations in California: Modifications and Long-Term Planning
-

 FINANCE2 years ago
Digital Asset Management in Florida Estate Planning